c01_box_violin 数据分布 (Distribution)
Nature Cell Lancet
Grouped Box & Half-Violin Raincloud Plot
半小提琴核密度、箱线图四分位数与原始散点雨云图,配以双组间显著性统计学括号。
🔬 矢量预览 (Vector Preview)
600 DPI Ready
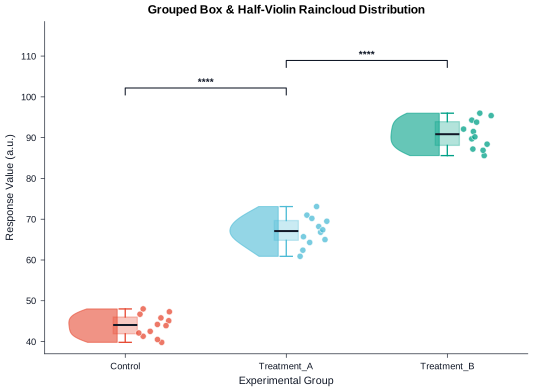
格式支持: SVG, PDF, PNG (600 DPI), TIFF
📊 统计学特性 (Statistical Features)
- ✓ 双样本 t 检验 / Mann-Whitney U
- ✓ 显著性星号标注 (*p<0.05)
- ✓ 半小提琴 KDE 拟合
- ✓ 原始数据点抖动 (Jitter)
🛡️ QC 质检要点 (QC Highlights)
- ✓ 坐标轴字号 ≥ 8pt
- ✓ 双格式导出 (SVG矢量 / 600 DPI PNG)
- ✓ 色盲安全色谱
- ✓ 去除非必要顶部/右侧边框
🎨 顶刊色彩提取器 (Palette Extractor)Nature
Crisp sans-serif typography, clean borderless spines, high-contrast palette with soft muted secondary accents.
🛡️ 无障碍评分:AAA (Deuteranopia & Protanopia Compliant)
📋 Data Contract 数据契约规范 Strict Schema
输入数据必须完全符合下列列名与数据类型规范,方可通过自动化数据前检 (Pre-flight Validation)。
| 字段名称 (Column) | 数据类型 (Type) | 约束性 | 语义说明与值域约束 |
|---|---|---|---|
| group | categorical | 必需 (Required) | Primary experimental group or condition |
| value | continuous | 必需 (Required) | Quantitative response measurement |
| subgroup | categorical | 可选 (Optional) | Secondary stratification factor (e.g., Sex, Batch) |
| sample_id | string | 可选 (Optional) | Unique specimen or replicate identifier |
组内最小样本量: n ≥ 3
最大允许缺失率: 5%
🐍 独立可复现 Python 绘图源码 Stand-alone Script
完全可复现的 Python 脚本,支持 CLI 参数 `--data`, `--style`, `--output-dir` 与模块化 `render()` 调用。
#!/usr/bin/env python3
"""FigureCraft Chart Engine: Grouped Box & Half-Violin Raincloud Plot (c01_box_violin)."""

import os
import sys
import argparse
from pathlib import Path
from typing import List, Dict, Optional, Tuple
import numpy as np
import pandas as pd
import matplotlib.pyplot as plt
from scipy import stats

try:
    from engines.styles import apply_style, get_palette
except ImportError:
    # Add project root to sys.path if run directly
    sys.path.insert(0, str(Path(__file__).resolve().parents[2]))
    from engines.styles import apply_style, get_palette

CHART_ID = "c01_box_violin"


def get_pvalue_asterisks(p_val: float) -> str:
    if p_val < 0.0001:
        return "****"
    elif p_val < 0.001:
        return "***"
    elif p_val < 0.01:
        return "**"
    elif p_val < 0.05:
        return "*"
    else:
        return "ns"


def draw_significance_bracket(ax, x1: float, x2: float, y: float, h: float, text: str, color: str = "#111827"):
    ax.plot([x1, x1, x2, x2], [y, y + h, y + h, y], lw=0.8, c=color)
    ax.text((x1 + x2) * 0.5, y + h * 1.1, text, ha='center', va='bottom', color=color, fontsize=7.5, fontweight='bold')


def render(
    data_path: Optional[str] = None,
    style: str = "nature",
    output_dir: str = "output",
    formats: Optional[List[str]] = None,
    dpi: int = 600,
) -> Dict[str, str]:
    if formats is None:
        formats = ["svg", "pdf", "png", "tiff"]
    if data_path is None:
        data_path = str(Path(__file__).resolve().parents[1] / "data" / f"{CHART_ID}.csv")

    apply_style(style)
    palette = get_palette(style)
    df = pd.read_csv(data_path)

    # Clean data
    df = df.dropna(subset=["group", "value"])
    groups = list(df["group"].unique())

    fig, ax = plt.subplots(figsize=(6.5, 4.5))

    group_positions = {grp: idx for idx, grp in enumerate(groups)}
    max_y = df["value"].max()
    min_y = df["value"].min()
    y_range = max_y - min_y if max_y != min_y else 1.0

    # Draw raincloud components for each group
    for i, grp in enumerate(groups):
        color = palette[i % len(palette)]
        grp_data = df[df["group"] == grp]["value"].values
        pos = group_positions[grp]

        # 1. Half-violin (KDE) on left (pos - delta)
        if len(grp_data) >= 3:
            kde = stats.gaussian_kde(grp_data)
            y_eval = np.linspace(grp_data.min(), grp_data.max(), 100)
            density = kde(y_eval)
            # Normalize density width
            max_w = 0.3
            scaled_density = (density / density.max()) * max_w
            ax.fill_betweenx(
                y_eval,
                pos - scaled_density - 0.05,
                pos - 0.05,
                color=color,
                alpha=0.6,
                edgecolor=color,
                linewidth=0.8,
            )

        # 2. Boxplot in center
        box_props = dict(facecolor=color, alpha=0.3, edgecolor=color, linewidth=1.0)
        median_props = dict(color="#111827", linewidth=1.5)
        whisker_props = dict(color=color, linewidth=1.0)
        capprops = dict(color=color, linewidth=1.0)

        ax.boxplot(
            grp_data,
            positions=[pos],
            widths=0.15,
            patch_artist=True,
            showfliers=False,
            boxprops=box_props,
            medianprops=median_props,
            whiskerprops=whisker_props,
            capprops=capprops,
        )

        # 3. Jittered raw points on right (pos + delta)
        np.random.seed(42 + i)
        jitter = np.random.uniform(0.08, 0.28, size=len(grp_data))
        ax.scatter(
            pos + jitter,
            grp_data,
            s=22,
            color=color,
            alpha=0.75,
            edgecolors="#FFFFFF",
            linewidth=0.5,
            zorder=3,
        )

    # Automated statistical significance testing between consecutive groups
    curr_bracket_y = max_y + y_range * 0.08
    bracket_h = y_range * 0.03
    for i in range(len(groups) - 1):
        g1_data = df[df["group"] == groups[i]]["value"].values
        g2_data = df[df["group"] == groups[i + 1]]["value"].values
        if len(g1_data) >= 3 and len(g2_data) >= 3:
            # Perform Welch's t-test
            _, p_val = stats.ttest_ind(g1_data, g2_data, equal_var=False)
            stars = get_pvalue_asterisks(p_val)
            draw_significance_bracket(ax, i, i + 1, curr_bracket_y, bracket_h, stars)
            curr_bracket_y += y_range * 0.12

    ax.set_xticks(range(len(groups)))
    ax.set_xticklabels(groups)
    ax.set_xlabel("Experimental Group")
    ax.set_ylabel("Response Value (a.u.)")
    ax.set_title("Grouped Box & Half-Violin Raincloud Distribution")
    ax.set_ylim(min_y - y_range * 0.05, curr_bracket_y + y_range * 0.08)

    # Save exports
    os.makedirs(output_dir, exist_ok=True)
    generated_files = {}
    for fmt in formats:
        out_path = os.path.join(output_dir, f"{CHART_ID}_{style}.{fmt}")
        fig.savefig(out_path, format=fmt, dpi=dpi, bbox_inches="tight")
        generated_files[fmt] = str(Path(out_path).resolve())

    plt.close(fig)
    return generated_files


if __name__ == "__main__":
    parser = argparse.ArgumentParser(description="Render Grouped Box & Half-Violin Raincloud Plot")
    parser.add_argument("--data", type=str, default=None, help="Path to input CSV dataset")
    parser.add_argument("--style", type=str, default="nature", choices=["nature", "cell", "lancet", "ieee", "economist"], help="Journal style pack")
    parser.add_argument("--output-dir", type=str, default="output", help="Output directory")
    parser.add_argument("--formats", type=str, default="svg,pdf,png,tiff", help="Comma-separated export formats")
    parser.add_argument("--dpi", type=int, default=600, help="Raster DPI")
    args = parser.parse_args()

    fmt_list = [f.strip() for f in args.formats.split(",") if f.strip()]
    results = render(args.data, style=args.style, output_dir=args.output_dir, formats=fmt_list, dpi=args.dpi)
    for fmt, path in results.items():
        print(f"Generated {fmt.upper()}: {path}")