c02_correlation_heatmap 相关分析 (Correlation)
Lancet IEEE Nature
Correlation Heatmap Matrix with Significance Asterisks
掩膜上三角的相关性热图矩阵,单元格内置 Pearson r 相关系数与显著性星号。
🔬 矢量预览 (Vector Preview)
600 DPI Ready
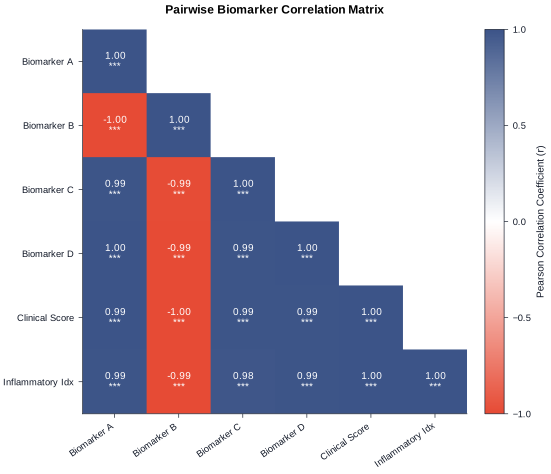
格式支持: SVG, PDF, PNG (600 DPI), TIFF
📊 统计学特性 (Statistical Features)
- ✓ Pearson / Spearman 相关系数
- ✓ 双尾显著性检验
- ✓ 上三角掩膜 (Masked Upper Triangle)
- ✓ 发散色谱居中归零
🛡️ QC 质检要点 (QC Highlights)
- ✓ 颜色刻度尺标注完整
- ✓ 数值文字与背景色对比度达标
- ✓ 矢量导出可编辑文字
- ✓ 对角线自相关清晰识别
🎨 顶刊色彩提取器 (Palette Extractor)Nature
Crisp sans-serif typography, clean borderless spines, high-contrast palette with soft muted secondary accents.
🛡️ 无障碍评分:AAA (Deuteranopia & Protanopia Compliant)
📋 Data Contract 数据契约规范 Strict Schema
输入数据必须完全符合下列列名与数据类型规范,方可通过自动化数据前检 (Pre-flight Validation)。
| 字段名称 (Column) | 数据类型 (Type) | 约束性 | 语义说明与值域约束 |
|---|---|---|---|
| biomarker_a | continuous | 必需 (Required) | Continuous feature 1 |
| biomarker_b | continuous | 必需 (Required) | Continuous feature 2 |
| biomarker_c | continuous | 必需 (Required) | Continuous feature 3 |
| biomarker_d | continuous | 可选 (Optional) | Continuous feature 4 |
| clinical_score | continuous | 可选 (Optional) | Clinical assessment score |
| inflammatory_idx | continuous | 可选 (Optional) | Inflammatory response index |
组内最小样本量: n ≥ 5
最大允许缺失率: 5%
🐍 独立可复现 Python 绘图源码 Stand-alone Script
完全可复现的 Python 脚本,支持 CLI 参数 `--data`, `--style`, `--output-dir` 与模块化 `render()` 调用。
#!/usr/bin/env python3
"""FigureCraft Chart Engine: Correlation Heatmap Matrix (c02_correlation_heatmap)."""

import os
import sys
import argparse
from pathlib import Path
from typing import List, Dict, Optional
import numpy as np
import pandas as pd
import matplotlib.pyplot as plt
import matplotlib.colors as mcolors
from scipy import stats

try:
    from engines.styles import apply_style, get_palette
except ImportError:
    sys.path.insert(0, str(Path(__file__).resolve().parents[2]))
    from engines.styles import apply_style, get_palette

CHART_ID = "c02_correlation_heatmap"


def get_pvalue_asterisks(p_val: float) -> str:
    if p_val < 0.001:
        return "***"
    elif p_val < 0.01:
        return "**"
    elif p_val < 0.05:
        return "*"
    else:
        return ""


def render(
    data_path: Optional[str] = None,
    style: str = "nature",
    output_dir: str = "output",
    formats: Optional[List[str]] = None,
    dpi: int = 600,
) -> Dict[str, str]:
    if formats is None:
        formats = ["svg", "pdf", "png", "tiff"]
    if data_path is None:
        data_path = str(Path(__file__).resolve().parents[1] / "data" / f"{CHART_ID}.csv")

    apply_style(style)
    palette = get_palette(style)
    df = pd.read_csv(data_path)

    # Select numeric columns
    numeric_df = df.select_dtypes(include=[np.number])
    cols = list(numeric_df.columns)
    n = len(cols)

    # Compute correlation matrix and p-value matrix
    corr_matrix = np.zeros((n, n))
    pval_matrix = np.zeros((n, n))

    for i in range(n):
        for j in range(n):
            valid_mask = (~numeric_df[cols[i]].isna()) & (~numeric_df[cols[j]].isna())
            x = numeric_df[cols[i]][valid_mask]
            y = numeric_df[cols[j]][valid_mask]
            if len(x) > 2:
                r, p = stats.pearsonr(x, y)
                corr_matrix[i, j] = r
                pval_matrix[i, j] = p
            else:
                corr_matrix[i, j] = 1.0 if i == j else 0.0
                pval_matrix[i, j] = 1.0

    # Mask upper triangle (k=1 excludes diagonal, or k=0 keeps lower)
    mask = np.triu(np.ones_like(corr_matrix, dtype=bool), k=1)
    masked_corr = np.ma.masked_array(corr_matrix, mask=mask)

    fig, ax = plt.subplots(figsize=(6.0, 5.2))

    # Construct diverging colormap tailored to journal palette
    c_neg = palette[0] if len(palette) > 0 else "#00468B"
    c_pos = palette[3] if len(palette) > 3 else "#E64B35"
    cmap = mcolors.LinearSegmentedColormap.from_list(
        "custom_diverging", [c_neg, "#FFFFFF", c_pos], N=256
    )

    im = ax.imshow(masked_corr, cmap=cmap, vmin=-1.0, vmax=1.0, aspect="equal")

    # Add text annotations with r-value and stars
    for i in range(n):
        for j in range(i + 1):
            val = corr_matrix[i, j]
            p_val = pval_matrix[i, j]
            stars = get_pvalue_asterisks(p_val)
            text_color = "#FFFFFF" if abs(val) > 0.65 else "#111827"

            label = f"{val:.2f}\n{stars}" if stars else f"{val:.2f}"
            ax.text(
                j, i, label,
                ha="center", va="center",
                color=text_color,
                fontsize=7.5,
                fontweight="medium"
            )

    # Set axes labels and ticks
    ax.set_xticks(range(n))
    ax.set_yticks(range(n))
    formatted_labels = [c.replace("_", " ").title() for c in cols]
    ax.set_xticklabels(formatted_labels, rotation=35, ha="right")
    ax.set_yticklabels(formatted_labels)
    ax.set_title("Pairwise Biomarker Correlation Matrix", pad=12)

    # Colorbar
    cbar = fig.colorbar(im, ax=ax, fraction=0.046, pad=0.04)
    cbar.set_label("Pearson Correlation Coefficient ($r$)", fontsize=7.5)
    cbar.set_ticks([-1.0, -0.5, 0.0, 0.5, 1.0])
    cbar.ax.tick_params(labelsize=7)

    # Remove extra spines
    for edge in ["top", "right"]:
        ax.spines[edge].set_visible(False)

    os.makedirs(output_dir, exist_ok=True)
    generated_files = {}
    for fmt in formats:
        out_path = os.path.join(output_dir, f"{CHART_ID}_{style}.{fmt}")
        fig.savefig(out_path, format=fmt, dpi=dpi, bbox_inches="tight")
        generated_files[fmt] = str(Path(out_path).resolve())

    plt.close(fig)
    return generated_files


if __name__ == "__main__":
    parser = argparse.ArgumentParser(description="Render Correlation Heatmap Matrix")
    parser.add_argument("--data", type=str, default=None, help="Path to input CSV dataset")
    parser.add_argument("--style", type=str, default="nature", choices=["nature", "cell", "lancet", "ieee", "economist"], help="Journal style pack")
    parser.add_argument("--output-dir", type=str, default="output", help="Output directory")
    parser.add_argument("--formats", type=str, default="svg,pdf,png,tiff", help="Comma-separated export formats")
    parser.add_argument("--dpi", type=int, default=600, help="Raster DPI")
    args = parser.parse_args()

    fmt_list = [f.strip() for f in args.formats.split(",") if f.strip()]
    results = render(args.data, style=args.style, output_dir=args.output_dir, formats=fmt_list, dpi=args.dpi)
    for fmt, path in results.items():
        print(f"Generated {fmt.upper()}: {path}")