c08_sankey 流向转移 (Flow)
Nature The Economist IEEE
Sankey / Flow Transition Diagram
多阶段分类流向桑基图 (Sankey Diagram),直观展示队列迁移、治疗线进展或能量分配平衡。
🔬 矢量预览 (Vector Preview)
600 DPI Ready
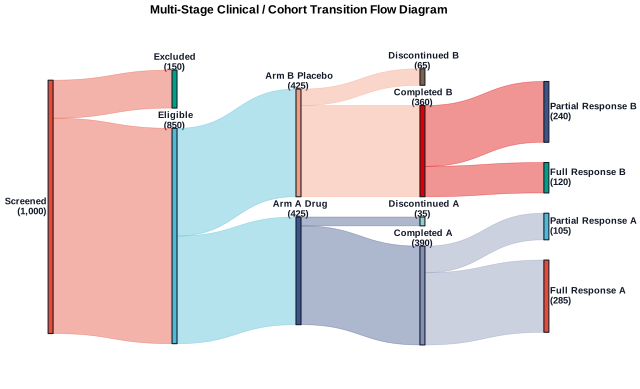
格式支持: SVG, PDF, PNG (600 DPI), TIFF
📊 统计学特性 (Statistical Features)
- ✓ 阶段流动流量守恒
- ✓ 贝塞尔曲面流道宽度映射
- ✓ 节点高度自适应累加
- ✓ 百分比占比计算
🛡️ QC 质检要点 (QC Highlights)
- ✓ 流道平滑连接无破面
- ✓ 节点文字水平对齐
- ✓ 色彩分类一致性
- ✓ 流转比例标签清晰
🎨 顶刊色彩提取器 (Palette Extractor)Nature
Crisp sans-serif typography, clean borderless spines, high-contrast palette with soft muted secondary accents.
🛡️ 无障碍评分:AAA (Deuteranopia & Protanopia Compliant)
📋 Data Contract 数据契约规范 Strict Schema
输入数据必须完全符合下列列名与数据类型规范,方可通过自动化数据前检 (Pre-flight Validation)。
| 字段名称 (Column) | 数据类型 (Type) | 约束性 | 语义说明与值域约束 |
|---|---|---|---|
| source | categorical | 必需 (Required) | Origin node or stage state |
| target | categorical | 必需 (Required) | Destination node or stage state |
| value | continuous | 必需 (Required) | Magnitude or volume of flow (min: 0.0001, max: None) |
| stage | categorical | 可选 (Optional) | Chronological stage or sequence index |
组内最小样本量: n ≥ 1
最大允许缺失率: 0%
🐍 独立可复现 Python 绘图源码 Stand-alone Script
完全可复现的 Python 脚本,支持 CLI 参数 `--data`, `--style`, `--output-dir` 与模块化 `render()` 调用。
#!/usr/bin/env python3
"""FigureCraft Chart Engine: Sankey / Flow Transition Diagram (c08_sankey)."""

import os
import sys
import argparse
from pathlib import Path
from typing import List, Dict, Optional, Tuple
import numpy as np
import pandas as pd
import matplotlib.pyplot as plt
from matplotlib.path import Path as MplPath
import matplotlib.patches as patches

try:
    from engines.styles import apply_style, get_palette
except ImportError:
    sys.path.insert(0, str(Path(__file__).resolve().parents[2]))
    from engines.styles import apply_style, get_palette

CHART_ID = "c08_sankey"


def compute_bezier_curve(p0: Tuple[float, float], p1: Tuple[float, float], p2: Tuple[float, float], p3: Tuple[float, float], n: int = 50) -> np.ndarray:
    t = np.linspace(0, 1, n)
    # B(t) = (1-t)^3 P0 + 3(1-t)^2 t P1 + 3(1-t) t^2 P2 + t^3 P3
    b = (1 - t)[:, None] ** 3 * p0 + \
        3 * (1 - t)[:, None] ** 2 * t[:, None] * p1 + \
        3 * (1 - t)[:, None] * t[:, None] ** 2 * p2 + \
        t[:, None] ** 3 * p3
    return b


def render(
    data_path: Optional[str] = None,
    style: str = "nature",
    output_dir: str = "output",
    formats: Optional[List[str]] = None,
    dpi: int = 600,
) -> Dict[str, str]:
    if formats is None:
        formats = ["svg", "pdf", "png", "tiff"]
    if data_path is None:
        data_path = str(Path(__file__).resolve().parents[1] / "data" / f"{CHART_ID}.csv")

    apply_style(style)
    palette = get_palette(style)
    df = pd.read_csv(data_path)
    df = df.dropna(subset=["source", "target", "value"])

    # Determine nodes and topological stages
    sources = df["source"].tolist()
    targets = df["target"].tolist()
    all_nodes = list(dict.fromkeys(sources + targets))

    # Infer stage hierarchy
    node_stages = {}
    for s in sources:
        if s not in targets and s not in node_stages:
            node_stages[s] = 0

    # Propagate stage numbers
    changed = True
    while changed:
        changed = False
        for _, row in df.iterrows():
            u, v = row["source"], row["target"]
            u_stage = node_stages.get(u, 0)
            if v not in node_stages or node_stages[v] < u_stage + 1:
                node_stages[v] = u_stage + 1
                changed = True

    max_stage = max(node_stages.values()) if node_stages else 1
    stages = {stage: [n for n, s in node_stages.items() if s == stage] for stage in range(max_stage + 1)}

    # Compute node total flows
    node_inflow = {n: 0.0 for n in all_nodes}
    node_outflow = {n: 0.0 for n in all_nodes}
    for _, row in df.iterrows():
        node_outflow[row["source"]] += float(row["value"])
        node_inflow[row["target"]] += float(row["value"])

    node_value = {n: max(node_inflow[n], node_outflow[n]) for n in all_nodes}
    # Max total height per stage
    stage_totals = {st: sum(node_value[n] for n in nodes) for st, nodes in stages.items()}
    max_total = max(stage_totals.values()) if stage_totals else 100.0

    fig, ax = plt.subplots(figsize=(7.5, 4.8))

    col_width = 0.04
    node_coords = {}
    node_colors = {}
    color_idx = 0

    # Layout nodes in vertical columns per stage
    gap = max_total * 0.08
    for st, nodes in stages.items():
        total_st_val = sum(node_value[n] for n in nodes) + gap * max(0, len(nodes) - 1)
        start_y = (max_total * 1.2 - total_st_val) / 2.0
        curr_y = start_y

        for n in nodes:
            h = node_value[n]
            node_coords[n] = (st, curr_y, h)
            col = palette[color_idx % len(palette)]
            node_colors[n] = col
            color_idx += 1

            # Draw node rectangle
            rect = patches.Rectangle(
                (st - col_width / 2, curr_y),
                col_width,
                h,
                facecolor=col,
                edgecolor="#111827",
                linewidth=0.8,
                zorder=4,
            )
            ax.add_patch(rect)

            # Node label
            formatted_name = n.replace("_", " ")
            label_text = f"{formatted_name}\n({int(h):,})"
            ha = "right" if st == 0 else ("left" if st == max_stage else "center")
            label_x = st - 0.03 if ha == "right" else (st + 0.03 if ha == "left" else st)
            label_y = curr_y + h / 2.0 if ha != "center" else curr_y + h + max_total * 0.03
            ax.text(
                label_x,
                label_y,
                label_text,
                fontsize=7.0,
                fontweight="bold",
                color="#111827",
                ha=ha,
                va="center",
            )
            curr_y += h + gap

    # Track current outlet and inlet offsets for nodes
    source_offsets = {n: node_coords[n][1] for n in all_nodes}
    target_offsets = {n: node_coords[n][1] for n in all_nodes}

    # Draw Bézier flows
    for _, row in df.iterrows():
        u, v, val = row["source"], row["target"], float(row["value"])
        u_x = node_coords[u][0] + col_width / 2
        v_x = node_coords[v][0] - col_width / 2

        u_y0 = source_offsets[u]
        u_y1 = u_y0 + val
        source_offsets[u] = u_y1

        v_y0 = target_offsets[v]
        v_y1 = v_y0 + val
        target_offsets[v] = v_y1

        # Control points for top and bottom curves
        dx = (v_x - u_x) * 0.5
        top_curve = compute_bezier_curve(
            (u_x, u_y1), (u_x + dx, u_y1), (v_x - dx, v_y1), (v_x, v_y1), n=40
        )
        bottom_curve = compute_bezier_curve(
            (v_x, v_y0), (v_x - dx, v_y0), (u_x + dx, u_y0), (u_x, u_y0), n=40
        )

        ribbon_pts = np.vstack([top_curve, bottom_curve])
        polygon = patches.Polygon(
            ribbon_pts,
            facecolor=node_colors[u],
            alpha=0.42,
            edgecolor=node_colors[u],
            linewidth=0.5,
            zorder=3,
        )
        ax.add_patch(polygon)

    ax.set_xlim(-0.25, max_stage + 0.25)
    ax.set_ylim(-max_total * 0.1, max_total * 1.3)
    ax.set_title("Multi-Stage Clinical / Cohort Transition Flow Diagram", pad=12)
    ax.axis("off")

    os.makedirs(output_dir, exist_ok=True)
    generated_files = {}
    for fmt in formats:
        out_path = os.path.join(output_dir, f"{CHART_ID}_{style}.{fmt}")
        fig.savefig(out_path, format=fmt, dpi=dpi, bbox_inches="tight")
        generated_files[fmt] = str(Path(out_path).resolve())

    plt.close(fig)
    return generated_files


if __name__ == "__main__":
    parser = argparse.ArgumentParser(description="Render Sankey Flow Diagram")
    parser.add_argument("--data", type=str, default=None, help="Path to input CSV dataset")
    parser.add_argument("--style", type=str, default="nature", choices=["nature", "cell", "lancet", "ieee", "economist"], help="Journal style pack")
    parser.add_argument("--output-dir", type=str, default="output", help="Output directory")
    parser.add_argument("--formats", type=str, default="svg,pdf,png,tiff", help="Comma-separated export formats")
    parser.add_argument("--dpi", type=int, default=600, help="Raster DPI")
    args = parser.parse_args()

    fmt_list = [f.strip() for f in args.formats.split(",") if f.strip()]
    results = render(args.data, style=args.style, output_dir=args.output_dir, formats=fmt_list, dpi=args.dpi)
    for fmt, path in results.items():
        print(f"Generated {fmt.upper()}: {path}")