c07_volcano 高通量组学 (Omics)
Nature Cell Lancet
High-Throughput Volcano Plot with Collision-Free Gene Labeling
转录组/蛋白质组差异表达高通量火山图,内置 adjustText 防重叠算法与显著性双阈值截断线。
🔬 矢量预览 (Vector Preview)
600 DPI Ready
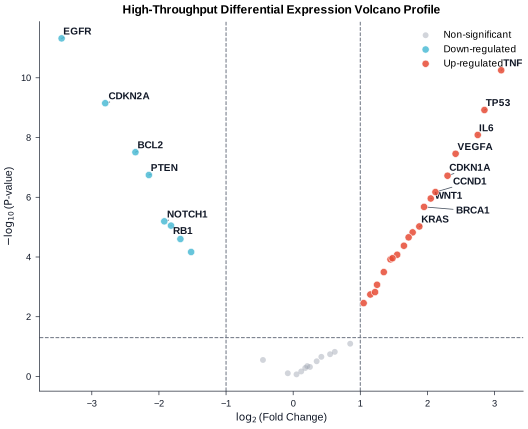
格式支持: SVG, PDF, PNG (600 DPI), TIFF
📊 统计学特性 (Statistical Features)
- ✓ log2(Fold-Change)
- ✓ -log10(p-value / FDR)
- ✓ 双阈值四象限分类
- ✓ 显著差异基因计数统计
🛡️ QC 质检要点 (QC Highlights)
- ✓ 核心候选基因标签 0 重叠碰撞
- ✓ 阈值虚线标注清晰
- ✓ 点半透明防止海量数据完全掩盖
- ✓ 高分辨率矢量导出
🎨 顶刊色彩提取器 (Palette Extractor)Nature
Crisp sans-serif typography, clean borderless spines, high-contrast palette with soft muted secondary accents.
🛡️ 无障碍评分:AAA (Deuteranopia & Protanopia Compliant)
📋 Data Contract 数据契约规范 Strict Schema
输入数据必须完全符合下列列名与数据类型规范,方可通过自动化数据前检 (Pre-flight Validation)。
| 字段名称 (Column) | 数据类型 (Type) | 约束性 | 语义说明与值域约束 |
|---|---|---|---|
| gene_symbol | string | 必需 (Required) | Gene or probe identifier (e.g., TP53, EGFR) |
| log2FC | continuous | 必需 (Required) | log2(Fold Change) effect size |
| pvalue | continuous | 必需 (Required) | Raw or nominal p-value (min: 0, max: 1) |
| padj | continuous | 可选 (Optional) | FDR adjusted p-value / q-value |
| is_highlight | boolean | 可选 (Optional) | Flag to force text label placement |
组内最小样本量: n ≥ 10
最大允许缺失率: 5%
🐍 独立可复现 Python 绘图源码 Stand-alone Script
完全可复现的 Python 脚本,支持 CLI 参数 `--data`, `--style`, `--output-dir` 与模块化 `render()` 调用。
#!/usr/bin/env python3
"""FigureCraft Chart Engine: Volcano Plot with Collision-Free Gene Labeling (c07_volcano)."""

import os
import sys
import argparse
from pathlib import Path
from typing import List, Dict, Optional
import numpy as np
import pandas as pd
import matplotlib.pyplot as plt
from adjustText import adjust_text

try:
    from engines.styles import apply_style, get_palette
except ImportError:
    sys.path.insert(0, str(Path(__file__).resolve().parents[2]))
    from engines.styles import apply_style, get_palette

CHART_ID = "c07_volcano"


def render(
    data_path: Optional[str] = None,
    style: str = "nature",
    output_dir: str = "output",
    formats: Optional[List[str]] = None,
    dpi: int = 600,
) -> Dict[str, str]:
    if formats is None:
        formats = ["svg", "pdf", "png", "tiff"]
    if data_path is None:
        data_path = str(Path(__file__).resolve().parents[1] / "data" / f"{CHART_ID}.csv")

    apply_style(style)
    palette = get_palette(style)
    df = pd.read_csv(data_path)
    df = df.dropna(subset=["gene_symbol", "log2FC", "pvalue"])

    # Transform coordinates
    df["neg_log10_p"] = -np.log10(np.clip(df["pvalue"], 1e-300, 1.0))
    fc_thresh = 1.0
    p_thresh = -np.log10(0.05)

    # Classify regulation
    df["regulation"] = "NS"
    df.loc[(df["log2FC"] >= fc_thresh) & (df["neg_log10_p"] >= p_thresh), "regulation"] = "Up"
    df.loc[(df["log2FC"] <= -fc_thresh) & (df["neg_log10_p"] >= p_thresh), "regulation"] = "Down"

    color_up = palette[0] if len(palette) > 0 else "#E64B35"
    color_down = palette[1] if len(palette) > 1 else "#4DBBD5"
    color_ns = "#9CA3AF"

    fig, ax = plt.subplots(figsize=(6.5, 5.0))

    # Scatter points by category
    for reg, col, label, alpha, z in [
        ("NS", color_ns, "Non-significant", 0.45, 2),
        ("Down", color_down, "Down-regulated", 0.85, 3),
        ("Up", color_up, "Up-regulated", 0.85, 4),
    ]:
        sub = df[df["regulation"] == reg]
        ax.scatter(
            sub["log2FC"],
            sub["neg_log10_p"],
            c=col,
            label=label,
            alpha=alpha,
            s=30 if reg != "NS" else 20,
            edgecolors="#FFFFFF" if reg != "NS" else "none",
            linewidth=0.5,
            zorder=z,
        )

    # Threshold guidelines
    ax.axvline(x=fc_thresh, color="#6B7280", linestyle="--", linewidth=0.75, zorder=1)
    ax.axvline(x=-fc_thresh, color="#6B7280", linestyle="--", linewidth=0.75, zorder=1)
    ax.axhline(y=p_thresh, color="#6B7280", linestyle="--", linewidth=0.75, zorder=1)

    # Label top / highlighted significant genes using adjustText
    to_label = df[df["regulation"] != "NS"]
    if "is_highlight" in df.columns:
        # Filter where is_highlight is true or top 10 most extreme
        highlight_mask = df["is_highlight"].astype(str).str.upper() == "TRUE"
        to_label = df[highlight_mask]

    if len(to_label) > 15:
        to_label = to_label.sort_values("neg_log10_p", ascending=False).head(15)

    texts = []
    for _, row in to_label.iterrows():
        t = ax.text(
            row["log2FC"],
            row["neg_log10_p"],
            row["gene_symbol"],
            fontsize=7.5,
            fontweight="semibold",
            color="#111827",
        )
        texts.append(t)

    if texts:
        adjust_text(
            texts,
            ax=ax,
            arrowprops=dict(arrowstyle="-", color="#4B5563", lw=0.6),
            expand=(1.2, 1.4),
        )

    ax.set_xlabel("$\log_2$(Fold Change)")
    ax.set_ylabel("$-\log_{10}$($P$-value)")
    ax.set_title("High-Throughput Differential Expression Volcano Profile")
    ax.legend(loc="upper right", frameon=False, fontsize=7.5)

    os.makedirs(output_dir, exist_ok=True)
    generated_files = {}
    for fmt in formats:
        out_path = os.path.join(output_dir, f"{CHART_ID}_{style}.{fmt}")
        fig.savefig(out_path, format=fmt, dpi=dpi, bbox_inches="tight")
        generated_files[fmt] = str(Path(out_path).resolve())

    plt.close(fig)
    return generated_files


if __name__ == "__main__":
    parser = argparse.ArgumentParser(description="Render Volcano Plot")
    parser.add_argument("--data", type=str, default=None, help="Path to input CSV dataset")
    parser.add_argument("--style", type=str, default="nature", choices=["nature", "cell", "lancet", "ieee", "economist"], help="Journal style pack")
    parser.add_argument("--output-dir", type=str, default="output", help="Output directory")
    parser.add_argument("--formats", type=str, default="svg,pdf,png,tiff", help="Comma-separated export formats")
    parser.add_argument("--dpi", type=int, default=600, help="Raster DPI")
    args = parser.parse_args()

    fmt_list = [f.strip() for f in args.formats.split(",") if f.strip()]
    results = render(args.data, style=args.style, output_dir=args.output_dir, formats=fmt_list, dpi=args.dpi)
    for fmt, path in results.items():
        print(f"Generated {fmt.upper()}: {path}")