c06_time_trend 时间序列 (Time-Series)
IEEE Nature The Economist
Multi-Series Time-Trend Plot with Confidence Interval Bands
多组别纵向时间趋势图,包含均值动态折线与半透明 95% 置信区间 (CI) 阴影填充带。
🔬 矢量预览 (Vector Preview)
600 DPI Ready
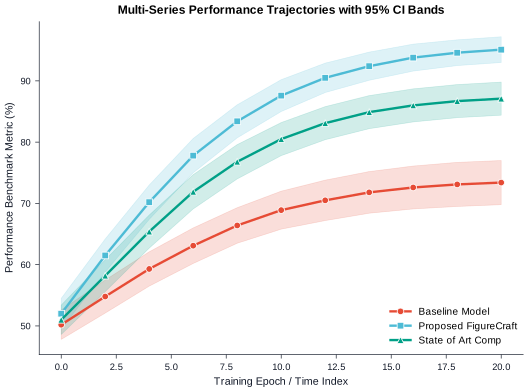
格式支持: SVG, PDF, PNG (600 DPI), TIFF
📊 统计学特性 (Statistical Features)
- ✓ 移动均值 / 分组聚合均值
- ✓ Bootstrap 95% 置信区间
- ✓ 时序节点连线平滑
- ✓ 组间方差带叠加
🛡️ QC 质检要点 (QC Highlights)
- ✓ 图例置于图内空白区域或顶部
- ✓ 置信区间透明度 (Alpha 0.15-0.25)
- ✓ 时间轴刻度格式统一
- ✓ 线条粗细层级清晰
🎨 顶刊色彩提取器 (Palette Extractor)Nature
Crisp sans-serif typography, clean borderless spines, high-contrast palette with soft muted secondary accents.
🛡️ 无障碍评分:AAA (Deuteranopia & Protanopia Compliant)
📋 Data Contract 数据契约规范 Strict Schema
输入数据必须完全符合下列列名与数据类型规范,方可通过自动化数据前检 (Pre-flight Validation)。
| 字段名称 (Column) | 数据类型 (Type) | 约束性 | 语义说明与值域约束 |
|---|---|---|---|
| time_step | continuous | 必需 (Required) | Temporal index, epoch, or continuous time measurement |
| series | categorical | 必需 (Required) | Model, cohort, or series identifier |
| value | continuous | 必需 (Required) | Continuous response or performance metric |
| ci_lower | continuous | 可选 (Optional) | Lower bound of confidence interval |
| ci_upper | continuous | 可选 (Optional) | Upper bound of confidence interval |
组内最小样本量: n ≥ 3
最大允许缺失率: 5%
🐍 独立可复现 Python 绘图源码 Stand-alone Script
完全可复现的 Python 脚本,支持 CLI 参数 `--data`, `--style`, `--output-dir` 与模块化 `render()` 调用。
#!/usr/bin/env python3
"""FigureCraft Chart Engine: Multi-Series Time-Trend Plot (c06_time_trend)."""

import os
import sys
import argparse
from pathlib import Path
from typing import List, Dict, Optional
import numpy as np
import pandas as pd
import matplotlib.pyplot as plt

try:
    from engines.styles import apply_style, get_palette
except ImportError:
    sys.path.insert(0, str(Path(__file__).resolve().parents[2]))
    from engines.styles import apply_style, get_palette

CHART_ID = "c06_time_trend"

MARKERS = ["o", "s", "^", "D", "v", "<", ">", "p"]


def render(
    data_path: Optional[str] = None,
    style: str = "nature",
    output_dir: str = "output",
    formats: Optional[List[str]] = None,
    dpi: int = 600,
) -> Dict[str, str]:
    if formats is None:
        formats = ["svg", "pdf", "png", "tiff"]
    if data_path is None:
        data_path = str(Path(__file__).resolve().parents[1] / "data" / f"{CHART_ID}.csv")

    apply_style(style)
    palette = get_palette(style)
    df = pd.read_csv(data_path)
    df = df.dropna(subset=["time_step", "series", "value"])

    series_names = list(df["series"].unique())

    fig, ax = plt.subplots(figsize=(6.5, 4.5))

    for i, s_name in enumerate(series_names):
        sub_df = df[df["series"] == s_name].sort_values("time_step")
        x = sub_df["time_step"].values
        y = sub_df["value"].values
        color = palette[i % len(palette)]
        marker = MARKERS[i % len(MARKERS)]

        # Line plot with markers
        ax.plot(
            x,
            y,
            label=s_name.replace("_", " "),
            color=color,
            linewidth=1.8,
            marker=marker,
            markersize=5.0,
            markeredgecolor="#FFFFFF",
            markeredgewidth=0.6,
            zorder=3,
        )

        # Shaded CI envelope
        if "ci_lower" in sub_df.columns and "ci_upper" in sub_df.columns:
            ci_low = sub_df["ci_lower"].values
            ci_high = sub_df["ci_upper"].values
            ax.fill_between(x, ci_low, ci_high, color=color, alpha=0.18, zorder=2)

    ax.set_xlabel("Training Epoch / Time Index")
    ax.set_ylabel("Performance Benchmark Metric (%)")
    ax.set_title("Multi-Series Performance Trajectories with 95% CI Bands")
    ax.legend(loc="lower right", frameon=False, fontsize=7.5)

    os.makedirs(output_dir, exist_ok=True)
    generated_files = {}
    for fmt in formats:
        out_path = os.path.join(output_dir, f"{CHART_ID}_{style}.{fmt}")
        fig.savefig(out_path, format=fmt, dpi=dpi, bbox_inches="tight")
        generated_files[fmt] = str(Path(out_path).resolve())

    plt.close(fig)
    return generated_files


if __name__ == "__main__":
    parser = argparse.ArgumentParser(description="Render Multi-Series Time-Trend Plot")
    parser.add_argument("--data", type=str, default=None, help="Path to input CSV dataset")
    parser.add_argument("--style", type=str, default="nature", choices=["nature", "cell", "lancet", "ieee", "economist"], help="Journal style pack")
    parser.add_argument("--output-dir", type=str, default="output", help="Output directory")
    parser.add_argument("--formats", type=str, default="svg,pdf,png,tiff", help="Comma-separated export formats")
    parser.add_argument("--dpi", type=int, default=600, help="Raster DPI")
    args = parser.parse_args()

    fmt_list = [f.strip() for f in args.formats.split(",") if f.strip()]
    results = render(args.data, style=args.style, output_dir=args.output_dir, formats=fmt_list, dpi=args.dpi)
    for fmt, path in results.items():
        print(f"Generated {fmt.upper()}: {path}")