c05_kaplan_meier 生存分析 (Survival)
Lancet Nature Cell
Kaplan-Meier Survival Curve with Number-at-Risk Table
Kaplan-Meier 临床生存曲线,配备 Log-rank 检验 p 值、95% CI 置信区间带与 X 轴对齐的在险人数表。
🔬 矢量预览 (Vector Preview)
600 DPI Ready
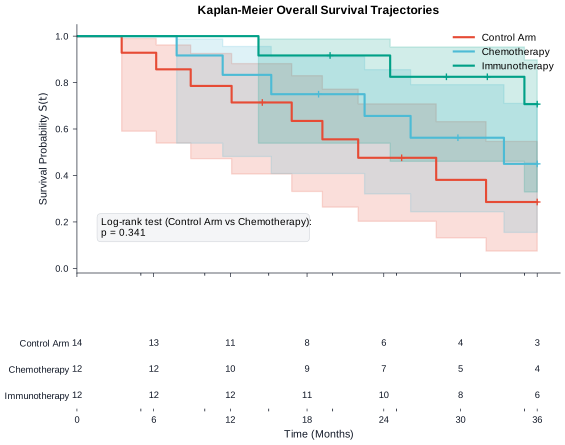
格式支持: SVG, PDF, PNG (600 DPI), TIFF
📊 统计学特性 (Statistical Features)
- ✓ Kaplan-Meier 阶梯生存率
- ✓ Log-rank 假说检验
- ✓ 截尾标记 (Censored ticks)
- ✓ 随访在险人数统计 (At-Risk Table)
🛡️ QC 质检要点 (QC Highlights)
- ✓ 在险人数表 X 轴刻度精准垂直对齐
- ✓ 截尾 '+' 符号大小适中
- ✓ 中位生存期参考虚线标注
- ✓ 期刊双栏宽度适配
🎨 顶刊色彩提取器 (Palette Extractor)Nature
Crisp sans-serif typography, clean borderless spines, high-contrast palette with soft muted secondary accents.
🛡️ 无障碍评分:AAA (Deuteranopia & Protanopia Compliant)
📋 Data Contract 数据契约规范 Strict Schema
输入数据必须完全符合下列列名与数据类型规范,方可通过自动化数据前检 (Pre-flight Validation)。
| 字段名称 (Column) | 数据类型 (Type) | 约束性 | 语义说明与值域约束 |
|---|---|---|---|
| cohort | categorical | 必需 (Required) | Treatment arm or cohort stratification |
| time | continuous | 必需 (Required) | Survival or follow-up time in months or days (min: 0, max: None) |
| event | binary | 必需 (Required) | Binary event indicator (1 = Event occurred, 0 = Censored) |
| patient_id | string | 可选 (Optional) | Unique patient or subject identifier |
组内最小样本量: n ≥ 5
最大允许缺失率: 5%
🐍 独立可复现 Python 绘图源码 Stand-alone Script
完全可复现的 Python 脚本,支持 CLI 参数 `--data`, `--style`, `--output-dir` 与模块化 `render()` 调用。
#!/usr/bin/env python3
"""FigureCraft Chart Engine: Kaplan-Meier Survival Curve (c05_kaplan_meier)."""

import os
import sys
import argparse
from pathlib import Path
from typing import List, Dict, Optional
import numpy as np
import pandas as pd
import matplotlib.pyplot as plt
from lifelines import KaplanMeierFitter
from lifelines.statistics import logrank_test

try:
    from engines.styles import apply_style, get_palette
except ImportError:
    sys.path.insert(0, str(Path(__file__).resolve().parents[2]))
    from engines.styles import apply_style, get_palette

CHART_ID = "c05_kaplan_meier"


def render(
    data_path: Optional[str] = None,
    style: str = "nature",
    output_dir: str = "output",
    formats: Optional[List[str]] = None,
    dpi: int = 600,
) -> Dict[str, str]:
    if formats is None:
        formats = ["svg", "pdf", "png", "tiff"]
    if data_path is None:
        data_path = str(Path(__file__).resolve().parents[1] / "data" / f"{CHART_ID}.csv")

    apply_style(style)
    palette = get_palette(style)
    df = pd.read_csv(data_path)
    df = df.dropna(subset=["cohort", "time", "event"])

    cohorts = list(df["cohort"].unique())
    max_time = df["time"].max()

    fig = plt.figure(figsize=(6.5, 5.2))
    gs = fig.add_gridspec(nrows=2, ncols=1, height_ratios=[3.8, 1.2], hspace=0.35)
    ax_main = fig.add_subplot(gs[0])
    ax_table = fig.add_subplot(gs[1], sharex=ax_main)

    kmfs = {}
    time_points = np.linspace(0, np.ceil(max_time / 6) * 6, 7).astype(int)

    for i, cohort in enumerate(cohorts):
        color = palette[i % len(palette)]
        mask = df["cohort"] == cohort
        kmf = KaplanMeierFitter()
        kmf.fit(df.loc[mask, "time"], df.loc[mask, "event"], label=cohort.replace("_", " "))
        kmfs[cohort] = kmf

        kmf.plot_survival_function(
            ax=ax_main,
            ci_show=True,
            ci_alpha=0.18,
            color=color,
            linewidth=1.6,
            show_censors=True,
            censor_styles={"marker": "+", "ms": 5.0, "mew": 1.0},
        )

    # Perform Log-rank test between first two cohorts if multiple cohorts exist
    if len(cohorts) >= 2:
        c1, c2 = cohorts[0], cohorts[1]
        m1, m2 = df["cohort"] == c1, df["cohort"] == c2
        results = logrank_test(df.loc[m1, "time"], df.loc[m2, "time"], df.loc[m1, "event"], df.loc[m2, "event"])
        p_val_str = f"p = {results.p_value:.3e}" if results.p_value < 0.001 else f"p = {results.p_value:.3f}"
        ax_main.text(
            0.05,
            0.15,
            f"Log-rank test ({c1.replace('_', ' ')} vs {c2.replace('_', ' ')}):\n{p_val_str}",
            transform=ax_main.transAxes,
            fontsize=7.5,
            bbox=dict(boxstyle="round,pad=0.4", facecolor="#F3F4F6", edgecolor="#D1D5DB", alpha=0.9),
        )

    ax_main.set_title("Kaplan-Meier Overall Survival Trajectories", pad=8)
    ax_main.set_ylabel("Survival Probability $S(t)$")
    ax_main.set_ylim(-0.02, 1.05)
    ax_main.set_xlim(0, max_time * 1.05)
    ax_main.legend(loc="upper right", frameon=False, fontsize=7.5)

    # Build Number-at-Risk Table
    ax_table.set_yticks(range(len(cohorts)))
    ax_table.set_yticklabels([c.replace("_", " ") for c in cohorts], fontsize=7.0)
    ax_table.set_xlabel("Time (Months)")

    for i, cohort in enumerate(cohorts):
        kmf = kmfs[cohort]
        for t in time_points:
            # Calculate number at risk at time t
            at_risk = (df[df["cohort"] == cohort]["time"] >= t).sum()
            ax_table.text(
                t,
                i,
                str(at_risk),
                ha="center",
                va="center",
                fontsize=7.0,
                color="#111827",
            )

    ax_table.set_xticks(time_points)
    ax_table.set_xlim(0, max_time * 1.05)
    ax_table.set_ylim(-0.5, len(cohorts) - 0.5)
    ax_table.invert_yaxis()

    # Style table axis
    for spine in ["top", "right", "left", "bottom"]:
        ax_table.spines[spine].set_visible(False)
    ax_table.tick_params(left=False, bottom=True, length=2.0)

    os.makedirs(output_dir, exist_ok=True)
    generated_files = {}
    for fmt in formats:
        out_path = os.path.join(output_dir, f"{CHART_ID}_{style}.{fmt}")
        fig.savefig(out_path, format=fmt, dpi=dpi, bbox_inches="tight")
        generated_files[fmt] = str(Path(out_path).resolve())

    plt.close(fig)
    return generated_files


if __name__ == "__main__":
    parser = argparse.ArgumentParser(description="Render Kaplan-Meier Survival Curve")
    parser.add_argument("--data", type=str, default=None, help="Path to input CSV dataset")
    parser.add_argument("--style", type=str, default="nature", choices=["nature", "cell", "lancet", "ieee", "economist"], help="Journal style pack")
    parser.add_argument("--output-dir", type=str, default="output", help="Output directory")
    parser.add_argument("--formats", type=str, default="svg,pdf,png,tiff", help="Comma-separated export formats")
    parser.add_argument("--dpi", type=int, default=600, help="Raster DPI")
    args = parser.parse_args()

    fmt_list = [f.strip() for f in args.formats.split(",") if f.strip()]
    results = render(args.data, style=args.style, output_dir=args.output_dir, formats=fmt_list, dpi=args.dpi)
    for fmt, path in results.items():
        print(f"Generated {fmt.upper()}: {path}")