c12_treemap 层级构成 (Composition)
The Economist Nature IEEE
Hierarchical Squarified Treemap
分层树状矩形图 (Treemap),以面积严格守恒的嵌套矩形展示多层级分类占比与结构分布。
🔬 矢量预览 (Vector Preview)
600 DPI Ready
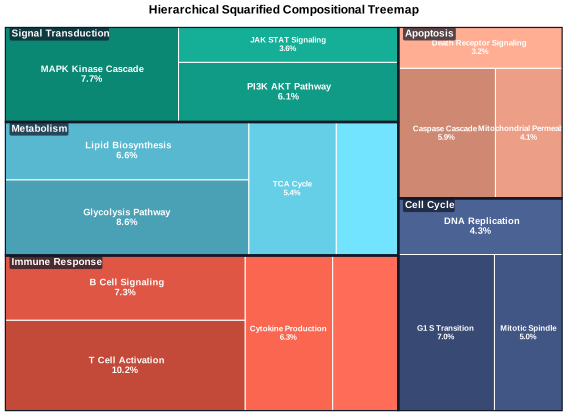
格式支持: SVG, PDF, PNG (600 DPI), TIFF
📊 统计学特性 (Statistical Features)
- ✓ Squarified 面积矩形分割算法
- ✓ 总体与子类别嵌套层级
- ✓ 面积正比于度量值
- ✓ 多层色系分类映射
🛡️ QC 质检要点 (QC Highlights)
- ✓ 矩形文字自动溢出裁剪或缩放
- ✓ 层级边框粗细分明 (主类粗/子类细)
- ✓ 百分比数字格式统一
- ✓ 小面积色块文字可辨
🎨 顶刊色彩提取器 (Palette Extractor)Nature
Crisp sans-serif typography, clean borderless spines, high-contrast palette with soft muted secondary accents.
🛡️ 无障碍评分:AAA (Deuteranopia & Protanopia Compliant)
📋 Data Contract 数据契约规范 Strict Schema
输入数据必须完全符合下列列名与数据类型规范,方可通过自动化数据前检 (Pre-flight Validation)。
| 字段名称 (Column) | 数据类型 (Type) | 约束性 | 语义说明与值域约束 |
|---|---|---|---|
| level_1 | categorical | 必需 (Required) | Top-level parent category or domain |
| level_2 | categorical | 必需 (Required) | Sub-category or child pathway name |
| value | continuous | 必需 (Required) | Quantitative weight, count, or size (min: 0.0001, max: None) |
| growth_metric | continuous | 可选 (Optional) | Secondary continuous metric mapped to lightness or color modulation |
组内最小样本量: n ≥ 1
最大允许缺失率: 5%
🐍 独立可复现 Python 绘图源码 Stand-alone Script
完全可复现的 Python 脚本,支持 CLI 参数 `--data`, `--style`, `--output-dir` 与模块化 `render()` 调用。
#!/usr/bin/env python3
"""FigureCraft Chart Engine: Hierarchical Squarified Treemap (c12_treemap)."""

import os
import sys
import argparse
from pathlib import Path
from typing import List, Dict, Optional, Tuple, Any
import numpy as np
import pandas as pd
import matplotlib.pyplot as plt
import matplotlib.patches as patches
import matplotlib.colors as mcolors

try:
    from engines.styles import apply_style, get_palette
except ImportError:
    sys.path.insert(0, str(Path(__file__).resolve().parents[2]))
    from engines.styles import apply_style, get_palette

CHART_ID = "c12_treemap"


def squarify(sizes: List[float], x: float, y: float, w: float, h: float) -> List[Tuple[float, float, float, float]]:
    """Pure-Python Squarified Treemap layout algorithm."""
    if not sizes:
        return []
    if len(sizes) == 1:
        return [(x, y, w, h)]

    total_size = sum(sizes)
    if total_size <= 0:
        return [(x, y, 0, 0) for _ in sizes]

    rectangles = []

    def layout_row(row_sizes: List[float], rx: float, ry: float, rw: float, rh: float, is_vertical: bool) -> List[Tuple[float, float, float, float]]:
        row_sum = sum(row_sizes)
        if row_sum <= 0:
            return [(rx, ry, 0, 0) for _ in row_sizes]
        res = []
        if is_vertical:
            row_w = rw * (row_sum / total_remaining)
            cur_y = ry
            for s in row_sizes:
                item_h = rh * (s / row_sum)
                res.append((rx, cur_y, row_w, item_h))
                cur_y += item_h
        else:
            row_h = rh * (row_sum / total_remaining)
            cur_x = rx
            for s in row_sizes:
                item_w = rw * (s / row_sum)
                res.append((cur_x, ry, item_w, row_h))
                cur_x += item_w
        return res

    def worst_ratio(row_sizes: List[float], side: float, total: float) -> float:
        if not row_sizes or side <= 0 or total <= 0:
            return float("inf")
        s = sum(row_sizes)
        s2 = s * s
        side2 = side * side
        max_v = max(row_sizes)
        min_v = min(row_sizes)
        return max((side2 * max_v) / s2, s2 / (side2 * min_v))

    # Standard squarify recursion
    cur_x, cur_y, cur_w, cur_h = x, y, w, h
    remaining = sizes[:]
    cur_row = []

    while remaining:
        total_remaining = sum(remaining) + sum(cur_row)
        side = min(cur_w, cur_h)
        item = remaining[0]
        new_row = cur_row + [item]

        if not cur_row or worst_ratio(new_row, side, total_remaining) <= worst_ratio(cur_row, side, total_remaining):
            cur_row = new_row
            remaining.pop(0)
        else:
            is_vert = cur_w >= cur_h
            laid = layout_row(cur_row, cur_x, cur_y, cur_w, cur_h, is_vert)
            rectangles.extend(laid)
            row_sum = sum(cur_row)
            if is_vert:
                used_w = cur_w * (row_sum / total_remaining)
                cur_x += used_w
                cur_w -= used_w
            else:
                used_h = cur_h * (row_sum / total_remaining)
                cur_y += used_h
                cur_h -= used_h
            cur_row = []

    if cur_row:
        total_remaining = sum(cur_row)
        is_vert = cur_w >= cur_h
        laid = layout_row(cur_row, cur_x, cur_y, cur_w, cur_h, is_vert)
        rectangles.extend(laid)

    return rectangles


def adjust_color_lightness(hex_color: str, factor: float) -> Tuple[float, float, float]:
    rgb = mcolors.to_rgb(hex_color)
    hsv = mcolors.rgb_to_hsv(rgb)
    new_v = np.clip(hsv[2] * factor, 0.2, 1.0)
    new_s = np.clip(hsv[1] * (1.1 - factor * 0.2), 0.2, 1.0)
    return mcolors.hsv_to_rgb([hsv[0], new_s, new_v])


def render(
    data_path: Optional[str] = None,
    style: str = "nature",
    output_dir: str = "output",
    formats: Optional[List[str]] = None,
    dpi: int = 600,
) -> Dict[str, str]:
    if formats is None:
        formats = ["svg", "pdf", "png", "tiff"]
    if data_path is None:
        data_path = str(Path(__file__).resolve().parents[1] / "data" / f"{CHART_ID}.csv")

    apply_style(style)
    palette = get_palette(style)
    df = pd.read_csv(data_path)
    df = df.dropna(subset=["level_1", "level_2", "value"])

    parents = list(dict.fromkeys(df["level_1"]))
    parent_totals = df.groupby("level_1")["value"].sum().to_dict()
    sorted_parents = sorted(parents, key=lambda p: parent_totals[p], reverse=True)
    parent_sizes = [parent_totals[p] for p in sorted_parents]

    fig, ax = plt.subplots(figsize=(7.5, 5.2))
    canvas_w, canvas_h = 100.0, 100.0

    # Layout top-level parents
    parent_rects = squarify(parent_sizes, 0, 0, canvas_w, canvas_h)

    for i, (p_name, (px, py, pw, ph)) in enumerate(zip(sorted_parents, parent_rects)):
        base_color = palette[i % len(palette)]
        sub_df = df[df["level_1"] == p_name].sort_values("value", ascending=False)
        child_sizes = sub_df["value"].tolist()
        child_names = sub_df["level_2"].tolist()

        # Layout children within parent box
        child_rects = squarify(child_sizes, px, py, pw, ph)

        for j, (c_name, c_val, (cx, cy, cw, ch)) in enumerate(zip(child_names, child_sizes, child_rects)):
            # Lightness modulation across children
            lightness_factor = 0.85 + (j % 4) * 0.12
            c_rgb = adjust_color_lightness(base_color, lightness_factor)

            rect = patches.Rectangle(
                (cx, cy), cw, ch,
                facecolor=c_rgb,
                edgecolor="#FFFFFF",
                linewidth=0.75,
                zorder=2,
            )
            ax.add_patch(rect)

            # Adaptive text labeling based on box size
            if cw > 12.0 and ch > 7.0:
                pct = (c_val / sum(parent_sizes)) * 100.0
                label_text = f"{c_name.replace('_', ' ')}\n{pct:.1f}%"
                font_sz = 7.0 if cw > 20.0 and ch > 12.0 else 6.0
                ax.text(
                    cx + cw * 0.5,
                    cy + ch * 0.5,
                    label_text,
                    ha="center",
                    va="center",
                    fontsize=font_sz,
                    fontweight="bold",
                    color="#FFFFFF",
                    zorder=3,
                )

        # Draw parent outline
        p_outline = patches.Rectangle(
            (px, py), pw, ph,
            facecolor="none",
            edgecolor="#111827",
            linewidth=1.8,
            zorder=4,
        )
        ax.add_patch(p_outline)

        # Parent title tag
        if pw > 15.0 and ph > 8.0:
            ax.text(
                px + 1.2,
                py + ph - 2.5,
                p_name.replace("_", " "),
                fontsize=7.5,
                fontweight="heavy",
                color="#FFFFFF",
                bbox=dict(boxstyle="round,pad=0.2", facecolor="#111827", alpha=0.7, lw=0),
                zorder=5,
            )

    ax.set_xlim(0, canvas_w)
    ax.set_ylim(0, canvas_h)
    ax.set_title("Hierarchical Squarified Compositional Treemap", pad=10)
    ax.axis("off")

    os.makedirs(output_dir, exist_ok=True)
    generated_files = {}
    for fmt in formats:
        out_path = os.path.join(output_dir, f"{CHART_ID}_{style}.{fmt}")
        fig.savefig(out_path, format=fmt, dpi=dpi, bbox_inches="tight")
        generated_files[fmt] = str(Path(out_path).resolve())

    plt.close(fig)
    return generated_files


if __name__ == "__main__":
    parser = argparse.ArgumentParser(description="Render Hierarchical Treemap")
    parser.add_argument("--data", type=str, default=None, help="Path to input CSV dataset")
    parser.add_argument("--style", type=str, default="nature", choices=["nature", "cell", "lancet", "ieee", "economist"], help="Journal style pack")
    parser.add_argument("--output-dir", type=str, default="output", help="Output directory")
    parser.add_argument("--formats", type=str, default="svg,pdf,png,tiff", help="Comma-separated export formats")
    parser.add_argument("--dpi", type=int, default=600, help="Raster DPI")
    args = parser.parse_args()

    fmt_list = [f.strip() for f in args.formats.split(",") if f.strip()]
    results = render(args.data, style=args.style, output_dir=args.output_dir, formats=fmt_list, dpi=args.dpi)
    for fmt, path in results.items():
        print(f"Generated {fmt.upper()}: {path}")