c11_editorial_step 政策与宏观 (Editorial)
The Economist FT Nature
The Economist / FT Editorial Step Chart
The Economist 经典社论阶梯图,具备标志性红色品牌色块、左对齐大标题、水平单向网格线与数据源落款。
🔬 矢量预览 (Vector Preview)
600 DPI Ready
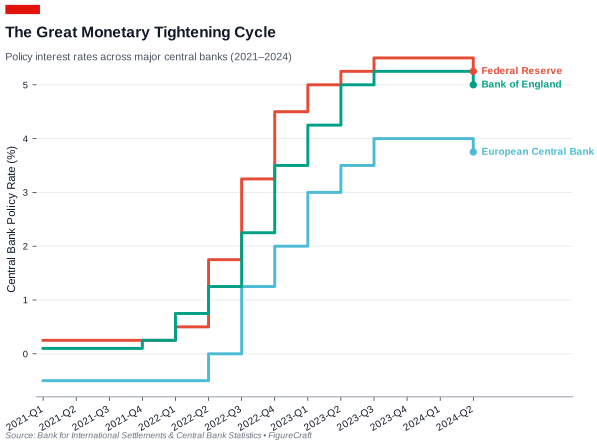
格式支持: SVG, PDF, PNG (600 DPI), TIFF
📊 统计学特性 (Statistical Features)
- ✓ 阶梯函数跃迁 (Step Transition)
- ✓ 基准水平线标注
- ✓ 离散时间节点对齐
- ✓ 历史关键时期背景阴影
🛡️ QC 质检要点 (QC Highlights)
- ✓ 遵循经济学人视觉规范
- ✓ 左上角粗体大标题+轻副标题
- ✓ 单向水平灰度网格线
- ✓ 图底注明数据出处
🎨 顶刊色彩提取器 (Palette Extractor)Nature
Crisp sans-serif typography, clean borderless spines, high-contrast palette with soft muted secondary accents.
🛡️ 无障碍评分:AAA (Deuteranopia & Protanopia Compliant)
📋 Data Contract 数据契约规范 Strict Schema
输入数据必须完全符合下列列名与数据类型规范,方可通过自动化数据前检 (Pre-flight Validation)。
| 字段名称 (Column) | 数据类型 (Type) | 约束性 | 语义说明与值域约束 |
|---|---|---|---|
| period | categorical | 必需 (Required) | Chronological period or quarter (e.g. 2022-Q1, 2022-Q2) |
| series | categorical | 必需 (Required) | Jurisdiction, central bank, or series name |
| value | continuous | 必需 (Required) | Policy interest rate, tariff percentage, or index |
组内最小样本量: n ≥ 3
最大允许缺失率: 0%
🐍 独立可复现 Python 绘图源码 Stand-alone Script
完全可复现的 Python 脚本,支持 CLI 参数 `--data`, `--style`, `--output-dir` 与模块化 `render()` 调用。
#!/usr/bin/env python3
"""FigureCraft Chart Engine: The Economist / FT Editorial Step Chart (c11_editorial_step)."""

import os
import sys
import argparse
from pathlib import Path
from typing import List, Dict, Optional
import numpy as np
import pandas as pd
import matplotlib.pyplot as plt
import matplotlib.patches as patches

try:
    from engines.styles import apply_style, get_palette
except ImportError:
    sys.path.insert(0, str(Path(__file__).resolve().parents[2]))
    from engines.styles import apply_style, get_palette

CHART_ID = "c11_editorial_step"


def render(
    data_path: Optional[str] = None,
    style: str = "economist",
    output_dir: str = "output",
    formats: Optional[List[str]] = None,
    dpi: int = 600,
) -> Dict[str, str]:
    if formats is None:
        formats = ["svg", "pdf", "png", "tiff"]
    if data_path is None:
        data_path = str(Path(__file__).resolve().parents[1] / "data" / f"{CHART_ID}.csv")

    apply_style(style)
    palette = get_palette(style)
    df = pd.read_csv(data_path)
    df = df.dropna(subset=["period", "series", "value"])

    periods = list(dict.fromkeys(df["period"]))
    period_idx = {p: i for i, p in enumerate(periods)}
    series_names = list(dict.fromkeys(df["series"]))

    fig, ax = plt.subplots(figsize=(7.2, 4.8))

    # Signature Top-Left Red Brand Block for Editorial Layout
    fig.patches.extend([
        patches.Rectangle(
            (0.08, 0.94),
            0.05,
            0.02,
            transform=fig.transFigure,
            facecolor="#E3120B",
            edgecolor="none",
            clip_on=False,
            zorder=10,
        )
    ])

    for i, s_name in enumerate(series_names):
        sub_df = df[df["series"] == s_name].copy()
        sub_df["x_num"] = sub_df["period"].map(period_idx)
        sub_df = sub_df.sort_values("x_num")

        x = sub_df["x_num"].values
        y = sub_df["value"].values
        color = palette[i % len(palette)]

        # Step curve
        ax.step(x, y, where="post", color=color, linewidth=2.2, label=s_name.replace("_", " "), zorder=3)
        # End marker
        ax.plot(x[-1], y[-1], marker="o", color=color, markersize=4.5, zorder=4)

        # Direct right label
        ax.text(
            x[-1] + 0.25,
            y[-1],
            s_name.replace("_", " "),
            color=color,
            fontsize=7.5,
            fontweight="bold",
            va="center",
        )

    ax.set_xticks(range(len(periods)))
    ax.set_xticklabels(periods, rotation=30, ha="right", fontsize=7.5)
    ax.set_ylabel("Central Bank Policy Rate (%)", fontsize=8.5)
    ax.set_xlim(-0.2, len(periods) + 2.0)

    # Title & Subtitle in Editorial style
    fig.text(
        0.08,
        0.89,
        "The Great Monetary Tightening Cycle",
        fontsize=11.5,
        fontweight="bold",
        color="#111827",
    )
    fig.text(
        0.08,
        0.84,
        "Policy interest rates across major central banks (2021–2024)",
        fontsize=8.0,
        color="#4B5563",
    )

    # Source footer
    fig.text(
        0.08,
        0.02,
        "Source: Bank for International Settlements & Central Bank Statistics • FigureCraft",
        fontsize=6.5,
        fontstyle="italic",
        color="#6B7280",
    )

    # Horizontal grid only
    ax.grid(axis="y", color="#E5E7EB", linestyle="-", linewidth=0.6)
    ax.grid(visible=False, axis="x")

    for spine in ["top", "right", "left"]:
        ax.spines[spine].set_visible(False)
    ax.spines["bottom"].set_color("#9CA3AF")
    ax.spines["bottom"].set_linewidth(0.8)

    os.makedirs(output_dir, exist_ok=True)
    generated_files = {}
    for fmt in formats:
        out_path = os.path.join(output_dir, f"{CHART_ID}_{style}.{fmt}")
        fig.savefig(out_path, format=fmt, dpi=dpi, bbox_inches="tight")
        generated_files[fmt] = str(Path(out_path).resolve())

    plt.close(fig)
    return generated_files


if __name__ == "__main__":
    parser = argparse.ArgumentParser(description="Render Editorial Step Chart")
    parser.add_argument("--data", type=str, default=None, help="Path to input CSV dataset")
    parser.add_argument("--style", type=str, default="economist", choices=["nature", "cell", "lancet", "ieee", "economist"], help="Journal style pack")
    parser.add_argument("--output-dir", type=str, default="output", help="Output directory")
    parser.add_argument("--formats", type=str, default="svg,pdf,png,tiff", help="Comma-separated export formats")
    parser.add_argument("--dpi", type=int, default=600, help="Raster DPI")
    args = parser.parse_args()

    fmt_list = [f.strip() for f in args.formats.split(",") if f.strip()]
    results = render(args.data, style=args.style, output_dir=args.output_dir, formats=fmt_list, dpi=args.dpi)
    for fmt, path in results.items():
        print(f"Generated {fmt.upper()}: {path}")